|
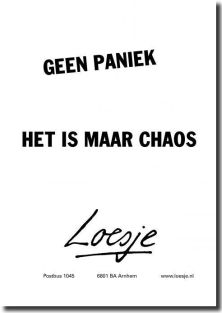
Geen reden voor paniek volgens Loesje
Gepubliceerd in
Losse flodders
mei 18 2019
Startup scaleup screwup (boekentip)
Gepubliceerd in
Boeken over Lean Six Sigma
mei 18 2019 Startup, Scaleup, Screwup
Risico vs. onzekerheid volgens Ash Maurya
Gepubliceerd in
Bluff Your Way Into
mei 16 2019 Ash Maurya legt in zijn boek Startup Lean - stapsgewijs van plan A naar een plan dat werkt het verschil uit tussen onzekerheid en risico:
[O]nzekerheid en risico zijn niet hetzelfde. Je kunt onzeker zijn over heel veel dingen die niet risicovol zijn. Douglas Hubbard maakt een duidelijk onderscheid tussen onzekerheid en risico in zijn boek How to Measure Anything:
Tags:
Klanten volgens Dave McClure
Gepubliceerd in
Citaten: kwaliteit
mei 15 2019
Klanten zijn niet bezig met jouw oplossing. Ze zijn bezig met hun problemen. Tags:
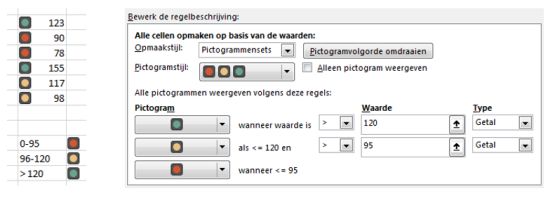
Pictogrammen plaatsen als voorwaardelijke opmaak
Gepubliceerd in
Bluff Your Way Into
mei 15 2019
Werken met voorwaardelijke opmaak Met voorwaardelijke opmaakt geeft Excel automatisch een kleur aan een cel, afhankelijk van de waarde in die cel. Zo laat u een bedrag verkleuren als dat boven een grens komt, of laat u het kleinste bedrag in een serie opvallen. Met een picogram kunt u laten zien of waarden gunstig zijn of niet; pictogrammen kunnen de vorm hebben van pijlen, rondjes, driehoeken en andere symbolen. Bron: Experthandboek Datavisualisatie in Excel, Wim de Groot
Management vs. leiderschap volgens Henry Mintzberg
Gepubliceerd in
Management
mei 14 2019
SMARTIE-doelen volgens Lingsma & Brabander
Gepubliceerd in
Bluff Your Way Into
mei 14 2019
In het boek Praktijkboek Teamcoaching Aan de slag beschrijven Marijke Lingsma en Roy de Brabander hoe het acroniem SMARTIE helpt bij het vergroten van de kans dat gestelde doelen ook daadwerkelijk worden gerealiseerd:
Werkmodel: SMARTIE Doel: monitoren en SMART maken horen ook bij het meten van resultaten. Wanneer in te zetten: hier hoort het houdingsaspect discipline bij. Voor veel mensen niet het meest motiverende aspect. Aantal personen: team Tijd: in het begin vraagt het de nodige aandacht, en terugkomen op gemaakte afspraken is van eminent belang. SMART is een afkorting van specifiek, meetbaar, acceptabel, realiseerbaar en tijdgebonden. Een nogal droge opsomming die een echt aantrekkelijke doelstelling tekortdoet, omdat er niet getoetst wordt op motivatie en inspiratie. Als teamcoach kun je aan de afkorting nog de I van inspirerend en de E van eigen controle toevoegen. Dan ontstaat SMARTIE, voor velen een bekende verwennerij uit hun jeugd. En ook nu wordt het nog gewaardeerd als je die tijdens een saaie teambijeenkomst uitdeelt of als beloning uitlooft voor degene(n) die de beste prestatie neerzet(ten) volgens het team. Door te werken met SMARTIE check je of een doelstelling haalbaar is.
A3-methode volgens Jeffrey Liker & Gary L. Convis
Gepubliceerd in
Lean Six Sigma
mei 13 2019
In het boek The Toyota Way to Lean Leadership beschrijven Jeffery LIker & Gary L. Convis het nut en de noodzaak van de A3-methode:
A3 Problem Solving Makes the Thinking Proces Visible (...) Mr Fumitake Ito became president of NUMMI and was not satisfied with the uptime of the body shop. He also noticed the body-shop engineers spending too much time in the office, which of course meant the problems were not going to get solved. In one meeting, he asked Gary to start a new practice. Whenever equipment was shut down for 30 minutes or more, he wanted a personal report from the engineers, with Gary present. The report should be on one piece of paper, the famous Toyota "A3 report" (after the A3 paper size used in the metric system). Ito did not offer a training course on A3, but rather asked for a 'breakdown report' for each instance and suggested that the Japanese engineers in the body shop would be able to show the American engineers how to prepare it. The purpose of the report is to produce, in a single page, a 'problem-solving story' that summarizes the problem, its root cause, and the countermeasures taken to solve the problem. ... The single-page report details the problem, the gap between the current and the ideal state, the countermeasures tried, the results, and further actions required. The engineers' job was not only to fix the breakdown but to identify why the breakdown happened and to address the root causes so that the breakdown would not be repeated. The engineers were to present the report personally to Ito and Gary within a week of the breakdown. By approaching the situation this way, Ito was addressing several needs at once. First, he was addressing the production problems that NUMMI was having in a sustainable way (rather than putting production goals first and just letting the Japanese engineers solve the problems). Second, he was creating a development opportunity for the American engineers to practice their problem-solving skills. By instituting the policy of having the American engineers take the lead and be responsible for the A3 reports, Ito-san was focing them to learn problem solving and learn the value of genchi genbutsu. Third, he was gving Gary an opportunity to be engaged in the problem-solving process and creating an opportunity to coach Gary in his responsibility to develop engineers. (...) The goal of filling out the A3 report, of course, is not to fill out the form perfectly, but to serve as an aid to clear thinking and learning in the problem-solving process. ... As every developing leader at Toyota learns, the reports are a powerful technique for developing problem-solving ability. (...) Any individual report was relatively unimportant in the grand scheme of developing leaders. The steady improvement in the reports showed the more important progress in developing the engineers and to see how they thought, how they reasoned, how they were going to prevent problems, and how they were going to sustain that prevention. Bron: The Toyota Way to Lean Leadership, Jeffery Liker & Gary L. Convis
Verspilling volgens Womack & Jones
Gepubliceerd in
Citaten: kwaliteit
mei 13 2019
Verspilling is iedere menselijke activiteit die wel middelen verbruikt maar geen waarde oplevert. Tags:
Sparklines in Excel volgens Wim de Groot
Gepubliceerd in
Management
mei 12 2019
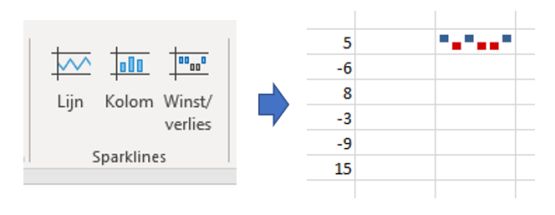
In het Experthandboek Datavisualisatie in Excel beschrijft Excel-goeroe Wim de Groot hoe je een zgn. sparkline kunt maken in Excel:
Grafieken die in één cel passen, zijn zogeheten sparklines. De sparklines zijn geïntroduceerd in Excel 2010. ... U kunt met sparklines een serie getallen weergeven als een lijn, als kolommen of als negatief/positief.
Een sparkline onder getallen plaatsen
... Selecteer [de] cellen, klik op de tab Invoegen en klik in de groep Sparklines op de knop Lijn.
Er gaat een venster open. Bij Gegevensbereik staat het gebied dat met deze sparkline zal worden weergegeven; dit gebied hebt u zojuist geselecteerd.
Geef bij Locatiebereik de cel op waarin u de sparkline wilt hebben; klik hiervoor op een cel onder de reeks. ... Klik op OK.
(...)
Sparklines aanpassen en opmaken
Als u een cel met sparkline selecteer, verschijnt het tabblad Ontwerpen. Met de knoppen daarin kunt u deze cel met zijn sparkline (of de hele groep) aanpassen.
Tags:
|
|
Meer artikelen...
|
|
|
| JPAGE_CURRENT_OF_TOTAL |
|
Whenever anything is being accomplished, it is being done, I have learned, by a monomaniac with a mission. Peter Drucker |
Categorieën
Citaten
Boeken over....
Archief
- agile (161)
- alignment (49)
- applicatiebeheer (62)
- applicatierationalisatie (27)
- architectuur (133)
- asl (35)
- asl1 vs. asl2 (5)
- ben kuiken (12)
- bisl (52)
- blij met rijsenbrij (8)
- boeken (5)
- boekentip (942)
- businesscase (20)
- clay shirky (5)
- communicatie (156)
- complexiteit (89)
- creativiteit (3)
- cultuur (63)
- david allen (32)
- deming (14)
- dilbert (185)
- dso (43)
- economie (5)
- effectief vergaderen (3)
- fan van ben (40)
- functioneel beheer (74)
- gelezen (62)
- governance (22)
- grappig (480)
- gtd (145)
- haarlem (2)
- hardlopen (20)
- het goede leven (3)
- hnw (6)
- inbox zero (8)
- infobesitas (12)
- informatiemanagement (352)
- informatievoorziening (2)
- ingelijst (111)
- innovatie (134)
- ism (7)
- itil (13)
- kwaliteit (875)
- lean (1517)
- lean six sigma (111)
- leeslijst (99)
- leiderschap (370)
- leren (795)
- lifehacking (852)
- lijfhacking (51)
- loesje (58)
- looijen (6)
- maes (17)
- management (1734)
- marketing (32)
- mindmapping (2)
- mintzberg (7)
- modellen (353)
- mooie woorden (24)
- motivatie (1572)
- motivational (7)
- negenvlaksmodel (25)
- omdenken (940)
- opdrachtgeverschap (47)
- persoonlijke effectiviteit (699)
- peter drucker (34)
- plaatjesmaker (6)
- plannen (44)
- powerpoint (11)
- presentatiepimpers (45)
- presenteren (78)
- processen (589)
- projectmanagement (116)
- quote (20)
- regie (8)
- requirements (134)
- rijnlands (171)
- rup (3)
- samenvatting (12)
- scrum (16)
- service management (11)
- seth godin (3)
- six sigma (109)
- softwareontwikkeling (239)
- statistiek (31)
- statistische begrippen (2)
- stephen covey (21)
- storytelling (26)
- strategie (281)
- systeemdenken (256)
- te bestellen (1)
- te leren (3)
- te lezen (875)
- te mooi voor woorden (17)
- technisch beheer (8)
- testen (16)
- trainingsvideo (2)
- veranderen (1208)
- verandermanagement (3)
- vergaderen (11)
Lean boeken top 5
|
|
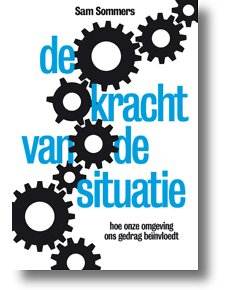
De kracht van de situatie |


