Asq.org beschrijft ook een - meer examengericht - Body of Knowledge (BoK) voor certificering van Green Belt:
I. Overview: Six Sigma and the Organization (15 Questions)
A. Six sigma and organizational goals
1. Value of six sigma
Recognize why organizations use six sigma, how they apply its philosophy and goals, and the origins of six sigma (Juran, Deming, Shewhart, etc.). Describe how process inputs, outputs, and feedback impact the larger organization. (Understand)
2. Organizational drivers and metrics
Recognize key drivers for business (profit, market share, customer satisfaction, efficiency, product differentiation) and how key metrics and scorecards are developed and impact the entire organization. (Understand)
3. Organizational goals and six sigma projects
Describe the project selection process including knowing when to use six sigma improvement methodology (DMAIC) as opposed to other problem-solving tools, and confirm that the project supports and is linked to organizational goals. (Understand)
B. Lean principles in the organization
1. Lean concepts and tools
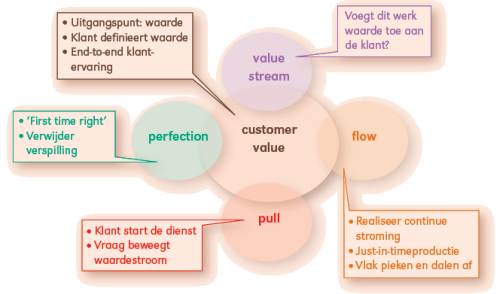
Define and describe concepts such as value chain, flow, pull, perfection, etc., and tools commonly used to eliminate waste, including kaizen, 5S, error-proofing, value-stream mapping, etc. (Understand)
2. Value-added and non-value-added activities
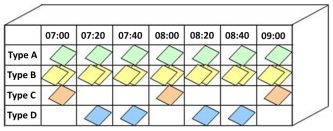
Identify waste in terms of excess inventory, space, test inspection, rework, transportation, storage, etc., and reduce cycle time to improve throughput. (Understand)
3. Theory of constraints
Describe the theory of constraints. (Understand)
C. Design for Six Sigma (DFSS) in the organization
1. Quality function deployment (QFD)
Describe how QFD fits into the overall DFSS process. (Understand) (Note: the application of QFD is covered in II.A.6.)
2. Design and process failure mode and effects analysis (DFMEA & PFMEA)
Define and distinguish between design FMEA (DFMEA) and process (PFMEA) and interpret associated data. (Analyze) (Note: the application of FMEA is covered in II.D.2.)
3. Road maps for DFSS
Describe and distinguish between DMADV (define, measure, analyze, design, verify) and IDOV (identify, design, optimize, verify), identify how they relate to DMAIC and how they help close the loop on improving the end product/process during the design (DFSS) phase. (Understand)
II. Six Sigma – Define (25 Questions)
A. Process Management for Projects
1. Process elements
Define and describe process components and boundaries. Recognize how processes cross various functional areas and the challenges that result for process improvement efforts. (Analyze)
2. Owners and stakeholders
Identify process owners, internal and external customers, and other stakeholders in a project. (Apply)
3. Identify customers
Identify and classify internal and external customers as applicable to a particular project, and show how projects impact customers. (Apply)
4. Collect customer data
Use various methods to collect customer feedback (e.g., surveys, focus groups, interviews, observation) and identify the key elements that make these tools effective. Review survey questions to eliminate bias, vagueness, etc. (Apply)
5. Analyze customer data
Use graphical, statistical, and qualitative tools to analyze customer feedback. (Analyze)
6. Translate customer requirements
Assist in translating customer feedback into project goals and objectives, including critical to quality (CTQ) attributes and requirements statements. Use voice of the customer analysis tools such as quality function deployment (QFD) to translate customer requirements into performance measures. (Apply)
B. Project management basics
1. Project charter and problem statement
Define and describe elements of a project charter and develop a problem statement, including baseline and improvement goals. (Apply)
2. Project scope
Assist with the development of project definition/scope using Pareto charts, process maps, etc. (Apply)
3. Project metrics
Assist with the development of primary and consequential metrics (e.g., quality, cycle time, cost) and establish key project metrics that relate to the voice of the customer. (Apply)
4. Project planning tools
Use project tools such as Gantt charts, critical path method (CPM), and program evaluation and review technique (PERT) charts, etc. (Apply)
5. Project documentation
Provide input and select the proper vehicle for presenting project documentation (e.g., spreadsheet output, storyboards, etc.) at phase reviews, management reviews and other presentations. (Apply)
6. Project risk analysis
Describe the purpose and benefit of project risk analysis, including resources, financials, impact on customers and other stakeholders, etc. (Understand)
7. Project closure
Describe the objectives achieved and apply the lessons learned to identify additional opportunities. (Apply)
C. Management and planning tools
Define, select, and use 1) affinity diagrams, 2) interrelationship digraphs, 3) tree diagrams, 4) prioritization matrices, 5) matrix diagrams, 6) process decision program (PDPC) charts, and 7) activity network diagrams. (Apply)
D. Business results for projects
1. Process performance
Calculate process performance metrics such as defects per unit (DPU), rolled throughput yield (RTY), cost of poor quality (COPQ), defects per million opportunities (DPMO) sigma levels and process capability indices. Track process performance measures to drive project decisions. (Analyze)
2. Failure mode and effects analysis (FMEA)
Define and describe failure mode and effects analysis (FMEA). Describe the purpose and use of scale criteria and calculate the risk priority number (RPN). (Analyze)
E. Team dynamics and performance
1. Team stages and dynamics
Define and describe the stages of team evolution, including forming, storming, norming, performing, adjourning, and recognition. Identify and help resolve negative dynamics such as overbearing, dominant, or reluctant participants, the unquestioned acceptance of opinions as facts, groupthink, feuding, floundering, the rush to accomplishment, attribution, discounts, plops, digressions, tangents, etc. (Understand)
2. Six sigma and other team roles and responsibilities
Describe and define the roles and responsibilities of participants on six sigma and other teams, including black belt, master black belt, green belt, champion, executive, coach, facilitator, team member, sponsor, process owner, etc. (Apply)
3. Team tools
Define and apply team tools such as brainstorming, nominal group technique, multi-voting, etc. (Apply)
4. Communication
Use effective and appropriate communication techniques for different situations to overcome barriers to project success. (Apply)
III. Six Sigma – Measure (30 Questions)
A. Process analysis and documentation
1. Process modeling
Develop and review process maps, written procedures, work instructions, flowcharts, etc. (Analyze)
2. Process inputs and outputs
Identify process input variables and process output variables (SIPOC), and document their relationships through cause and effect diagrams, relational matrices, etc. (Analyze)
B. Probability and statistics
1. Drawing valid statistical conclusions
Distinguish between enumerative (descriptive) and analytical (inferential) studies, and distinguish between a population parameter and a sample statistic. (Apply)
2. Central limit theorem and sampling distribution of the mean
Define the central limit theorem and describe its significance in the application of inferential statistics for confidence intervals, control charts, etc. (Apply)
3. Basic probability concepts
Describe and apply concepts such as independence, mutually exclusive, multiplication rules, etc. (Apply)
C. Collecting and summarizing data
1. Types of data and measurement scales
Identify and classify continuous (variables) and discrete (attributes) data. Describe and define nominal, ordinal, interval, and ratio measurement scales. (Analyze)
2. Data collection methods
Define and apply methods for collecting data such as check sheets, coded data, etc. (Apply)
3. Techniques for assuring data accuracy and integrity
Define and apply techniques such as random sampling, stratified sampling, sample homogeneity, etc. (Apply)
4. Descriptive statistics
Define, compute, and interpret measures of dispersion and central tendency, and construct and interpret frequency distributions and cumulative frequency distributions. (Analyze)
5. Graphical methods
Depict relationships by constructing, applying and interpreting diagrams and charts such as stem-and-leaf plots, box-and-whisker plots, run charts, scatter diagrams, Pareto charts, etc. Depict distributions by constructing, applying and interpreting diagrams such as histograms, normal probability plots, etc. (Create)
D. Probability distributions
Describe and interpret normal, binomial, and Poisson, chi square, Student’s t, and F distributions. (Apply)
E. Measurement system analysis
Calculate, analyze, and interpret measurement system capability using repeatability and reproducibility (GR&R), measurement correlation, bias, linearity, percent agreement, and precision/tolerance (P/T). (Evaluate)
F. Process capability and performance
1. Process capability studies
Identify, describe, and apply the elements of designing and conducting process capability studies, including identifying characteristics, identifying specifications and tolerances, developing sampling plans, and verifying stability and normality. (Evaluate)
2. Process performance vs. specification
Distinguish between natural process limits and specification limits, and calculate process performance metrics such as percent defective. (Evaluate)
3. Process capability indices
Define, select, and calculate Cp and Cpk, and assess process capability. (Evaluate)
4. Process performance indices
Define, select, and calculate Pp, Ppk, Cpm, and assess process performance. (Evaluate)
5. Short-term vs. long-term capability
Describe the assumptions and conventions that are appropriate when only short-term data are collected and when only attributes data are available. Describe the changes in relationships that occur when long-term data are used, and interpret the relationship between long- and short-term capability as it relates to a 1.5 sigma shift. (Evaluate)
6. Process capability for attributes data
Compute the sigma level for a process and describe its relationship to Ppk. (Apply)
IV. Six Sigma – Analyze (15 Questions)
A. Exploratory data analysis
1. Multi-vari studies
Create and interpret multi-vari studies to interpret the difference between positional, cyclical, and temporal variation; apply sampling plans to investigate the largest sources of variation. (Create)
2. Simple linear correlation and regression
Interpret the correlation coefficient and determine its statistical significance (p-value); recognize the difference between correlation and causation. Interpret the linear regression equation and determine its statistical significance (p-value). Use regression models for estimation and prediction. (Evaluate)
B. Hypothesis testing
1. Basics
Define and distinguish between statistical and practical significance and apply tests for significance level, power, type I and type II errors. Determine appropriate sample size for various test. (Apply).
2. Tests for means, variances, and proportions
Define, compare, and contrast statistical and practical significance. (Apply)
3. Paired-comparison tests
Define and describe paired-comparison parametric hypothesis tests. (Understand)
4. Single-factor analysis of variance (ANOVA)
Define terms related to one-way ANOVAs and interpret their results and data plots. (Apply)
5. Chi square
Define and interpret chi square and use it to determine statistical significance. (Analyze)
V. Six Sigma – Improve & Control (15 Questions)
A. Design of experiments (DOE)
1. Basic terms
Define and describe basic DOE terms such as independent and dependent variables, factors and levels, response, treatment, error, repetition, and replication. (Understand)
2. Main effects
Interpret main effects and interaction plots. (Apply)
B. Statistical process control (SPC)
1. Objectives and benefits
Describe the objectives and benefits of SPC, including controlling process performance, identifying special and common causes, etc. (Analyze)
2. Rational subgrouping
Define and describe how rational subgrouping is used. (Understand)
3. Selection and application of control charts
Identify, select, construct, and apply the following types of control charts: ?R, ?s, individuals and moving range (ImR / XmR), median (), p, np, c, and u. (Apply)
4. Analysis of control charts
Interpret control charts and distinguish between common and special causes using rules for determining statistical control. (Analyze)
C. Implement and validate solutions
Use various improvement methods such as brainstorming, main effects analysis, multi-vari studies, FMEA, measurement system capability re-analysis, and post-improvement capability analysis to identify, implement, and validate solutions through F-test, t-test, etc . (Create)
D. Control plan
Assist in developing a control plan to document and hold the gains, and assist in implementing controls and monitoring systems. (Apply)
Voor alle bovengenoemde begrippen gelden - zoals aangegeven per begrip - zes verschillende cognitieve niveaus:
-
Remember: be able to remember or recognize terminology, definitions, facts, ideas, materials, patterns, sequences, methodologies, principles, etc. (Also commonly referred to as recognition, recall, or rote knowledge).
-
Understand: be able to read and understand descriptions, communications, reports, tables, diagrams, directions, regulations, etc.
-
Apply: be able to apply ideas, procedures, methods, formulas, principles, theories, etc., in job-related situations.
-
Analyze: be able to break down information into its constituent parts and recognize the parts’ relationship to one another and how they are organized; identify sublevel factors or salient data from a complex scenario.
-
Evaluate: be able to make judgments regarding the value of proposed ideas, solutions, methodologies, etc., by using appropriate criteria or standards to estimate accuracy, effectiveness, economic benefits, etc.
-
Create: be able to put parts or elements together in such a way as to show a pattern or structure not clearly there before; able to identify which data or information from a complex set is appropriate to examine further or from which supported conclusions can be drawn.
Bron: http://prdweb.asq.org/certification/control/six-sigma-green-belt/bok
IASSC geeft aan welke eisen gelden voor Lean Six Sigma Green Belt certificering ('Universally Accepted Lean Six Sigma Body of Knowledge for Green Belts'). De officiële toets bestaat uit een 3 uur durend - open boek - examen waarin 100 multiple choice vragen moeten worden beantwoord.
Ik ben zelf in opleiding voor Lean Grean Belt en gebruik de onderstaande 'Body of Knowledge (BOK)' als kapstok voor het verzamelen van alles wat ik moet weten voor het examen.
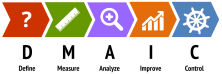
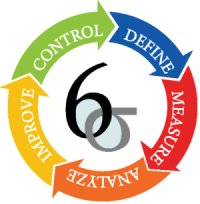
0.0 Lean Six Sigma improvement methodology (DMAIC, Define, Measure, Analyze, Improve & Control)
1.0 Define Phase
1.1 The Basics of Six Sigma
1.1.1 Meanings of Six Sigma
1.1.2 General History of Six Sigma & Continuous Improvement
1.1.3 Deliverables of a Lean Six Sigma Project
1.1.4 The Problem Solving Strategy Y = f(x)
1.1.5 Voice of the Customer (VOC), Voice of the Business (VOB) and Voice of the Employee (VOE)
1.1.6 Six Sigma Roles & Responsibilities
1.2 The Fundamentals of Six Sigma
1.2.1 Defining a Process
1.2.2 Critical to Quality Characteristics (CTQ’s)
1.2.3 Cost of Poor Quality (COPQ)
1.2.4 Pareto Analysis (80:20 rule)
1.2.5 Basic Six Sigma Metrics
- DPU
- DPMO
- FTY
- Rolled Throughput Yield (RTY)
- Cycle Time
1.3 Selecting Lean Six Sigma Projects
1.3.1 Building a Business Case & Project Charter
1.3.2 Developing Project Metrics
1.3.3 Financial Evaluation & Benefits Capture
1.4 The Lean Enterprise
1.4.1 Understanding Lean
1.4.2 The History of Lean
1.4.3 Lean & Six Sigma
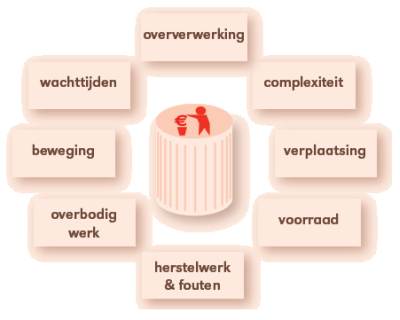
1.4.4 The Seven Elements of Waste
- Overproduction,
- Correction,
- Inventory,
- Motion,
- Overprocessing,
- Conveyance,
- Waiting
1.4.5 5S
- Straitghten,
- Shine,
- Standardize,
- Self-Discipline,
- Sort
2.0 Measure Phase
2.1 Process Definition
2.1.1 Cause & Effect / Fishbone Diagrams
2.1.2 Process Mapping, SIPOC, Value Stream Map
2.1.3 X-Y Diagram
2.1.4 Failure Modes & Effects Analysis (FMEA)
2.2 Six Sigma Statistics
2.2.1 Basic Statistics
2.2.2 Descriptive Statistics
2.2.3 Normal Distributions & Normality
2.2.4 Graphical Analysis
2.3 Measurement System Analysis (Meetsysteemanalyse; MSA)
2.3.1 Precision & Accuracy
2.3.2 Bias, Linearity & Stability
2.3.3 Gage Repeatability & Reproducibility
2.3.4 Variable & Attribute MSA
2.4 Process Capability
2.4.1 Capability Analysis
2.4.2 Concept of Stability
2.4.3 Attribute & Discrete Capability
2.4.4 Monitoring Techniques
3.0 Analyze Phase
3.1 Patterns of Variation
3.1.1 Multi-Vari Analysis
3.1.2 Classes of Distributions
3.2 Inferential Statistics
3.2.1 Understanding Inference
3.2.2 Sampling Techniques & Uses
3.2.3 Central Limit Theorem
3.3 Hypothesis Testing
3.3.1 General Concepts & Goals of Hypothesis Testing
3.3.2 Significance; Practical vs. Statistical
3.3.3 Risk; Alpha & Beta
3.3.4 Types of Hypothesis Test
3.4 Hypothesis Testing with Normal Data
3.4.1 1 & 2 sample t-tests
3.4.2 1 sample variance
3.4.3 One Way ANOVA
a. Including Tests of Equal Variance, Normality Testing and Sample Size calculation, performing tests and interpreting results.
3.5 Hypothesis Testing with Non-Normal Data
3.5.1 Mann-Whitney
3.5.2 Kruskal-Wallis
3.5.3 Mood’s Median
3.5.4 Friedman
3.5.5 1 Sample Sign
3.5.6 1 Sample Wilcoxon
3.5.7 One and Two Sample Proportion
3.5.8 Chi-Squared (Contingency Tables)
a. Including Tests of Equal Variance, Normality Testing and Sample Size calculation, performing tests and interpreting results.
4.0 Improve Phase
4.1 Simple Linear Regression
4.1.1 Correlation
4.1.2 Regression Equations
4.1.3 Residuals Analysis
4.2 Multiple Regression Analysis
4.2.1 Non- Linear Regression
4.2.2 Multiple Linear Regression
4.2.3 Confidence & Prediction Intervals
4.2.4 Residuals Analysis
4.2.5 Data Transformation, Box Cox
5.0 Control Phase
5.1 Lean Controls
5.1.1 Control Methods for 5S
5.1.2 Kanban
5.1.3 Poka-Yoke (Mistake Proofing)
5.2 Statistical Process Control (SPC)
5.2.1 Data Collection for SPC
5.2.2 I-MR Chart
5.2.3 Xbar-R Chart
5.2.4 U Chart
5.2.5 P Chart
5.2.6 NP Chart
5.2.7 X-S chart
5.2.8 CumSum Chart
5.2.9 EWMA Chart
5.2.10 Control Chart Anatomy
5.3 Six Sigma Control Plans
5.3.1 Cost Benefit Analysis
5.3.2 Elements of the Control Plan
5.3.3 Elements of the Response Plan
Bron: Universally Accepted Lean Six Sigma Body of Knowledge for Green Belts