![]()
The Glenday Sieve (GS)
Some years ago management consultant Ian Glenday made a discovery that builds on the 80/20 rule. And its application may prove useful to your company. It’s called the Glenday Sieve (GS). It was developed after Glenday discovered that for a high proportion of businesses 50 percent of sales come from a mere six percent of products (or SKUs). He also found that 95 percent of sales typically come from around 50 percent of products.
While that’s pretty useful to know, the real beauty of the GS is that can be applied not just to products and services, but to a variety of business processes, units and activities that make a company tick. The insights gained from a GS analysis can be used to make capability improvements, identify weak spots and eliminate waste and under-performance.
(...)
So what does a GS look like?
glenday sieve table 1Here is a simplified version of the GS, identifying the highest to the lowest performing SKU categories via a colour coding that labels processes by output volume. Using this as a guide, the SKUs in the high-volume green category would be focused on for quality and efficiency improvements as that’s where the greatest opportunities lie. As for those in the red category, decisions would need to be made as to whether it’s worth maintaining those SKUS. Perhaps it would be best to ditch them altogether if there’s not the potential make worthwhile improvements.
Bron: https://www.jiwa.com.au/using-the-glenday-sieve-to-boost-your-bottom-line/![]()
Productstromen en de Glenday Sieve
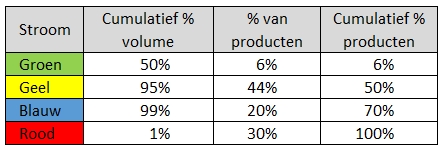
Voordat we konden beginnen met het inrichten van het werkproces hebben we de verschillende productstromen in kaart gebracht, op basis van de zogenaamde “Glenday Sieve”. Deze verfijning van het 80/20 principe zegt dat een klein deel van je producten of productfamilies zorgen voor een groot deel van je te maken volume. Deze producten worden de “groene stroom” genoemd .
Het idee is vervolgens om je proces in te richten op basis van deze groene stroom, om vervolgens steeds meer producten langs die weg te gaan maken.
Bron: https://www.procesverbeteren.nl/LEAN/Lean_waterschap_hunze_aas.php
![]()
Glenday sieve
What is it?
The Glenday Sieve is an approach to identifying common groups of procedures, conditions or activities in healthcare. These processes are grouped by volume of activity in the first instance, helping you to identify specific areas that could be the focus of improvement efforts. Focusing improvement on a few, high volume activities can deliver significant gains for the organisation. The approach has its origins in the Pareto principle, but has a stronger operational focus.
When to use it
The Glenday Sieve gives you a practical starting point to focus your improvement efforts. It helps to ensure that the gains from improvement are maximised.
How to use it
The Glenday Sieve separates procedures, conditions or activities, initially through the Pareto analysis of current volumes.
Bron: https://www.england.nhs.uk/wp-content/uploads/2021/03/qsir-glenday-sieve.pdf![]()
Repeterende producten met lage variëteit lijken in een High Variety Low Volume-omgeving (HVLV) vaak niet herkend te worden. Deze worden behandeld als alle andere HVLV-producten. Dat is een gemiste kans om doorlooptijd te stabiliseren en te verkorten en besturingslast te reduceren. Hoe deze kans te verzilveren was de belangrijkste take-away van de masterclass.
(...)
De vraaganalyse op basis van de Glenday Sieve verdeelt producten in vier categorien: groen, geel, blauw en rood. Met name de groene producten (6% artikelen, 50% omzet) en de rode (30% artikelen, 1% omzet) zijn interessant.
• In de praktijk worden de groene producten veelal in grote series geproduceerd, hierdoor blokkeren deze de doorlooptijd van de rode producten. Reduceren van seriegroottes helpt om dit te voorkomen.
• Het gebruik van capaciteitsbuffers voor de groene stroom producten bij shared resources creëert ruimte voor prioriteit op onvoorspelbare vraag naar gele en rode producten. Dit zorgt dan voor acceptabele levertijden zonder voorraden.
• Berekening van capaciteitsbuffers of veiligheidsvoorraad op basis van variatie levert vaak verrassende inzichten op.
Bron: https://blog3.han.nl/technologieensamenleving/weet-u-welk-aandeel-van-uw-artikelenbestand-50-van-uw-omzet-bepaalt![]()
By the way, the result of the Glenday Sieve analysis is to break down products, services, revenue streams, activities (or whatever is being analyzed) into "streams." The six percent leading to the top 50 percent of volume is called the "Green" stream. The next ~44 percent of that adds 45 percent of the volume (to the 95 percent cumulative level) is referred to as the "Yellow" stream. In many cases, the last five percent (5%) of business volume is distributed across the remaining 50 percent of SKUs, products, customers or whatever aspect is being "sieved," and is referred to as the "Red" stream. (In some cases, the "Red" stream is further segmented. In the accompanying figure, the "sieve" was being run by SKU. In our case above, however, we are doing the analysis of activity based on revenues.)
Bron: https://www.rklesolutions.com/blog/segment-market-glenday-sieve![]()
A Tool to Help
A useful tool I have come to call the “Glenday Sieve” separates products (SKU’s) into four groups based on sales volume (or value if this is more appropriate). The results shown are typical. Many people insist that it is impossible for such a small percent of the product range to account for 50% of the sales volume in their business. Yet when the analysis is done, it is invariably found to be the case. These results are intuitive for
some and genuinely shocking for others. Either way the power is in the indisputable information it provides.
It is not difficult to develop a fixed sequenced cycle for just 6% of the products, and then value stream mapping these items to help unravel the “spaghetti” pathways one usually finds through the plant. The end result is a “green stream” for these few high volume products, with shorter throughput times and continuous flow.
The “yellow” SKU’s are where to direct your capability improvement efforts, with exercises such as change over reduction and smaller batch sizes so making it easier to introduce these products into the cycle. This typically results in a staggering 95% of the total volume yet only 50% of the product range now running in a fixed sequence “every product every cycle” schedule.
The “blue” SKU’s are typically 20% of the product range, but just 4% of sales. What opportunities are there here for the harmonisation of raw materials and packaging so the final product appears different to customers but makes these SKU’s easier to include in the cycle? For instance, differently coloured bottles with the same shape, or labelled rather than printed cartons. These may sound like simple things but they can make a big difference in getting these products into the cycle and making them flow.
The “red” SKU’s will need to be carefully reviewed to determine their real business cost versus their benefit. The impact of these products to the total supply chain and overall company costs, including overheads, must be understood to be certain that the benefits of retailing them genuinely outweigh the costs. It is not uncommon for companies to recognise through this analysis that they actually have two distinct
businesses. One is high volume with the same products, for which the plant, business processes and performance measurement systems were designed. The other is a low volume customised job shop operation, which is being managed through the same equipment, processes and systems for both “green” and “red” SKU’s, to the detriment of customer responsiveness and profit margins.
Bron: http://www.repetitiveflexiblesupply.com/pdf/movingToFlow.pdf![]()
Glenday verlegt de traditionele focus op schaalvoordelen (economies of scale) naar een focus op voordelen die voortvloeien uit voorspelbaarheid, stabiliteit en herhaling (economies of repetition).
Deze voordelen kun je het gemakkelijkst en het snelst behalen bij de producten en/of diensten die het belangrijkst zijn voor je voortbestaan (dus vaak: die met de meeste omzet). Om deze producten en/of diensten eruit te ‘zeven’, introduceert Glenday de Glenday Sieve (de Zeef van Glenday), met de beroemde groene, gele, blauwe en rode stroom. Hiermee kun je effectief focus creëren om snel te grootste resultaten te boeken bij je eerste stap richting nivellering.
Bron: https://www.managementboek.nl/boek/9780955147302/breaking-through-to-flow-ian-glenday?affiliate=2766
![]()
It is important to know where one should standardize (green) versus be flexible, allowing personal interpretation and experience to prevail (red).
An analysis technique that allows practitioners to prioritize and target improvement efforts on a few high-volume procedures, processes, units or activities (PPUAs).
GS classifies and color-codes all PPUAs into four different volume groups. For example, if a manufacturer makes 200 different parts, GS maintains that approximately 12 parts account for 50 percent of sales; these 12 parts would be in the green group and would ideally be the focus of any initial improvement activities, as they would yield the greatest benefit.
Bron: https://www.isixsigma.com/dictionary/glenday-sieve-gs/


